Navajo Bridge Reverse Engineering Project
APPL 160 – Statics
The final project for Intro to Materials Science was a reverse engineering project. For the project, we were asked to reverse-engineer the 1994 Navajo bridge which spans the Grand Canyon in a remote area of northern Arizona. The instructions were to reverse-engineer the bridge using only the pictures and bridge statistics provided and some research into material properties of steel and concrete as appropriate. A Matlab-based truss solver was used to model the internal forces and deflection of the bridge under its load. Additionally we were instructed to investigate an open-ended question of our choosing.

Navajo Bridge Image Provided by Professor
Statistics Provided:
- Total length: 909 feet
- Steel arch length: 726 feet
- Arch rise: 90 feet
- Height above river: 470 feet
- Width of the roadway: 44 feet
- Amount of steel: 3,900,000 lbs
- Amount of concrete: 1,790 cubic yards
- Amount of steel reinforcement: 434,000 lbs
- Construction cost $14,700,000
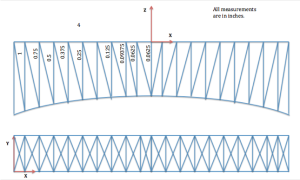
The first step in the project was researching the materials used to construct Navajo Bridge. Next, we measured the pictures to estimate the number of nodes (joints) and members (beams) as well as the relative lengths of these elements (below). The following simplifications were made to facilitate the bridge simulation. These simplifications eliminated a significant chunk of steel and nodes which would have helped support the bridge.
Simplifications:
- All members are straight lines (arch consists of tangent lines)
- All of the cross-sectional areas are identical
- No node at center of X intersections
- Disregarded horizontal beams that the real bridge contains between roadway and arch

Navajo bridge Measurements Sample
Stress Map
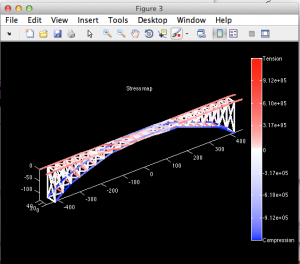
Once the number of nodes and members were determined, a MATLAB-based truss solver was used to model internal forces and deflection. The figure below shows a stress map of the bridge. Members along the roadway are held in tension while those along the arch are in compression. The compression of the arch is what holds up the bridge, pressing the bridge into the rock wall. The horizontal members that connect the arches are in tension. Forces are dissipated from the members between the roadway and the arch. This is this is observable by the white lines because the tension forced down from the roadway is countered by the upward compression force from the arch. Additionally, the bridge would be most likely to fail in the center. If a load pressing down on the bridge was too great, it could put too much tension on the arch way causing it to collapse.
[ ]
]
Modifications
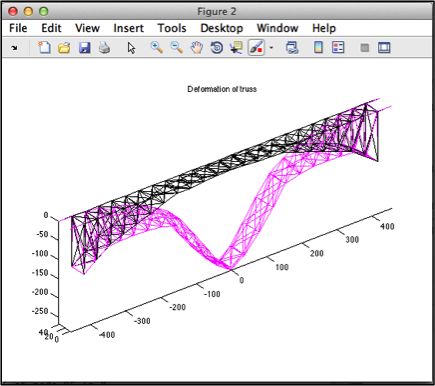
My group modified the bridge by adding the weight of one semi-trailer truck (80,000 lbs) to each of the nodes on the top, back side of the bridge. This would simulate if a row of semi-trailer trucks tried to cross the bridge in one direction, all at the same time. The result of this modification can be seen in the two figures below. Initially, the weight was distributed across all top loads (left). The bridge failure observed in this case was likely exaggerated due to the simplifications in our design previously addressed. To make our simplified model more realistic, we decided to try to re-design our weight distribution.
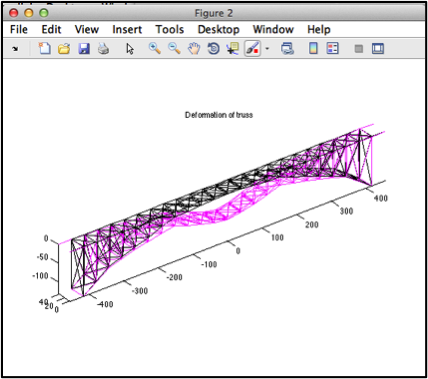
To re-design our model, we used a ratio for weight distribution between the vertical members and roadway nodes to redistribute the steel frame mass proportionally to each node. The outcome of this modification was still insufficient, so we took 2/3 of the weight of the middle 11 nodes on each side of the bridge and redistributed it to the other nodes closer to the canyon wall. Finally, this distributed yielded better support (right).
 |
 |
| Force loading until point of failure. Weight evenly distributed across all roadway nodes reworked | Reworked loading with better support |
For this project, I was responsible for estimating 3D coordinates, compiling coordinates and nodes into an Excel sheet, estimating loads of all components, finding the elastic modulus, finding the cross-sectional area, and completing load correction.